Acupuncture practice · Paid Media
How we turned break-even Meta leads into a 4.2× ROAS channel and cut cost per lead 86%
Instant forms replaced with a digital assessment, AI UGC creative, and a landing page rebuilt for completion
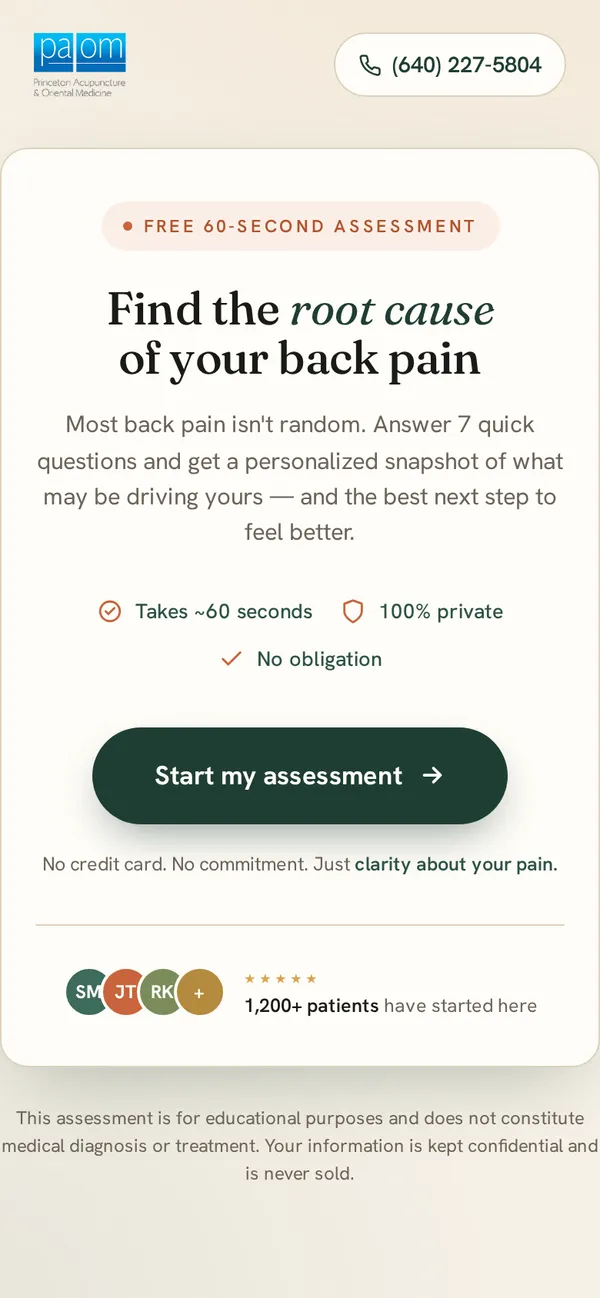
- −86%
Cost per lead after the redesign
- 4.2×
Average ROAS over six months
- 9:1
First-month ROAS
- Client
- Princeton Acupuncture & Oriental Medicine
- Industry
- Acupuncture practice
- Constraint
- Lead quality & acquisition economics
- Service
- Paid Media
- Timeline
- Six months on the assessment funnel, then the first redesign month
The challenge
The practice was running Meta instant forms. Cost per lead looked attractive, but the leads never left Facebook, rarely engaged with the offer, and results were break-even at best. The problem was not “more leads.” It was profitable patient acquisition — a funnel that selects for intent before a lead reaches the CRM.
01
Cheap, weakly qualified leads
Instant forms captured contact details and little else. Follow-up time went to prospects who had never engaged with the practice’s offer.
02
Break-even economics
A low cost per lead that only breaks even, or loses money after follow-up time, is a false economy.
03
No intent filter
Nothing in the funnel separated the curious from the ready before a lead entered the CRM.
04
The wrong scoreboard
The account was judged on cost per lead, not on revenue returned per dollar of spend.
02
The approach
The work was sequenced around acquisition economics, not vanity CPL. Pricing, offer, and the assessment funnel stayed constant while we iterated creative and, later, the landing page, so every result below is measured against a stable baseline.
01
Replace instant forms with a digital assessment
Meta traffic moved to an on-site assessment. Intentional friction: prospects leave Facebook, complete a longer intake, and convert only after showing real interest. Cost per lead rose versus instant forms, as expected. The bet was that qualification would more than pay for it.
02
Refresh creative with AI UGC video
Around month four we introduced AI-generated UGC-style video. The strongest performer paired it with one of the practice’s own videos, and it became the account’s best-producing creative as the campaign matured.
03
Measure economics on a stable offer
Early ROAS and multi-month averages were the primary scoreboard: lead quality and revenue, not the cheapest CPL.
04
Redesign the assessment page for completion
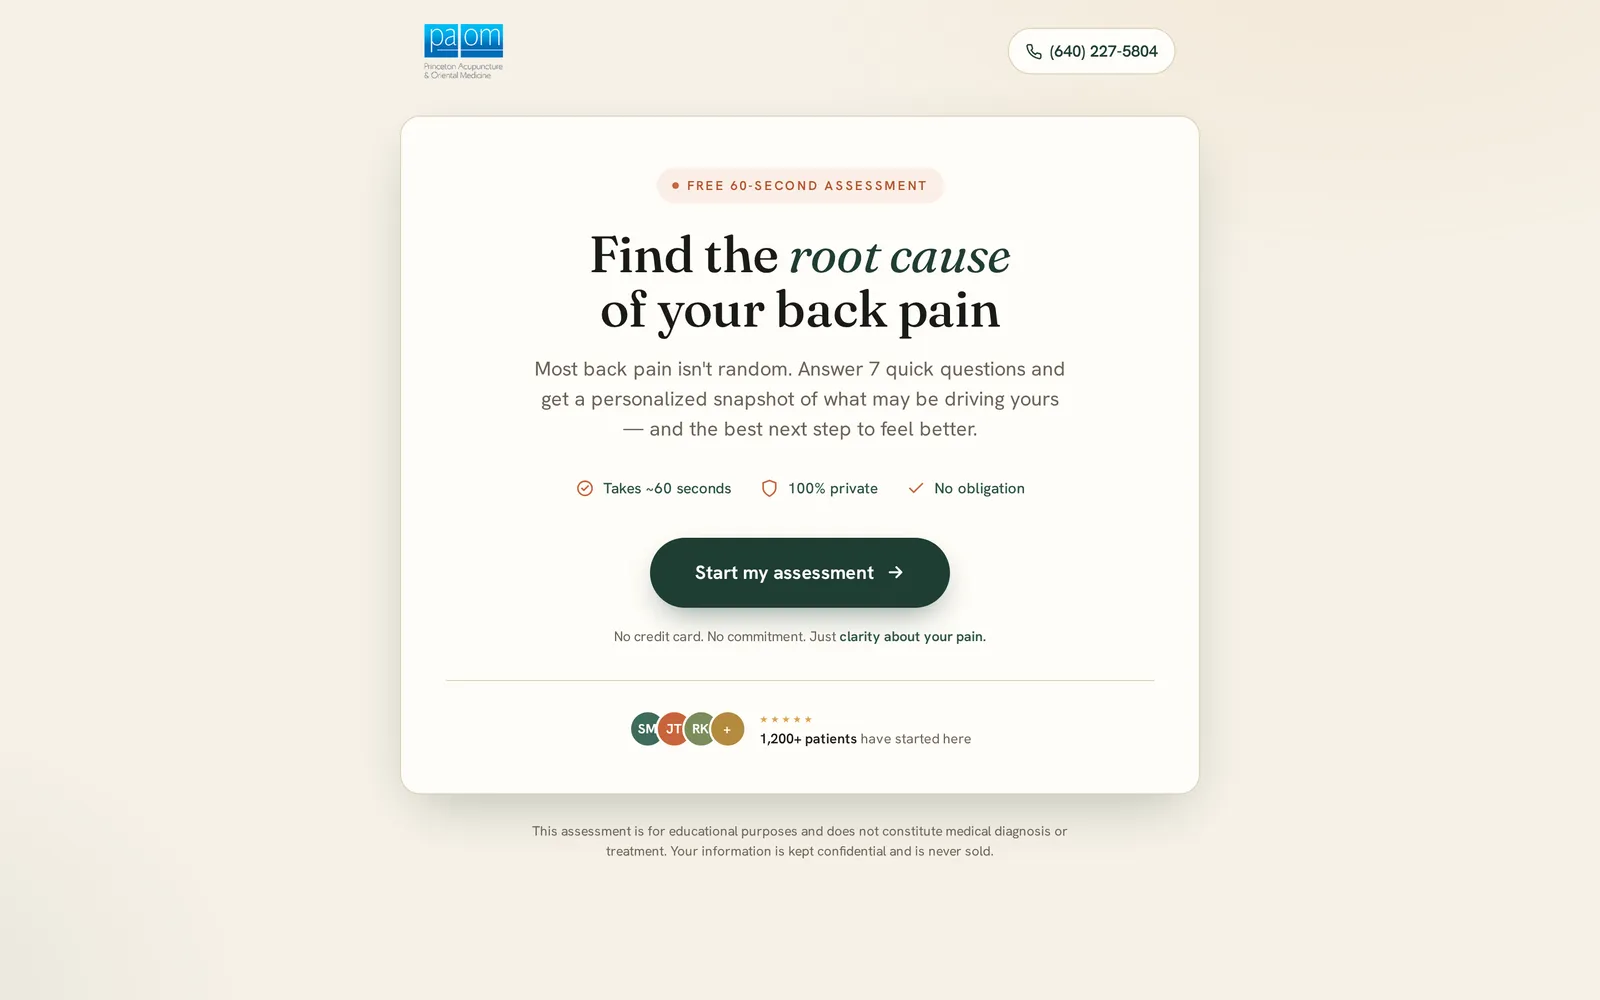
After about six months, page conversion was the clear constraint. Same campaign, same offer: larger tap targets, faster load, clearer progress, and no header, footer, or hero. The page stopped behaving like a brochure and started behaving like an intake tool.
The results
No changes were made to pricing or the service offering during the measurement period. The only variables were lead format (instant form → assessment), creative (including the month-four AI UGC refresh), and later the landing page.
Cost per lead
First month after the landing-page redesign, same campaign and offer. About 31% below the original instant-form cost.
First-month ROAS
First month on the digital assessment versus the instant-form era.
Average ROAS
Six months on the assessment campaign.
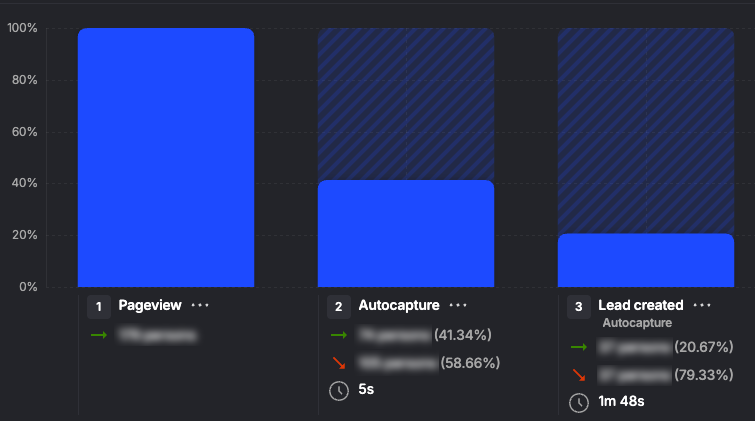
Landing page → lead
Pageview to lead created on the redesigned funnel.
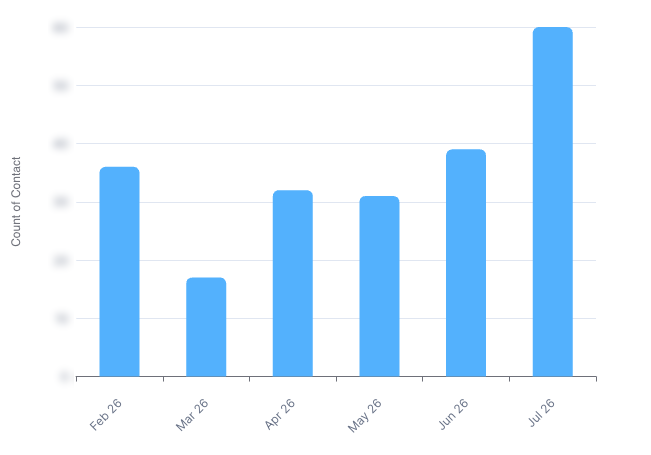
Monthly lead volume
First redesign month, with spend and offer held constant.
What it means
The practice no longer chooses between cheap leads that don’t pay and expensive leads that do. The assessment selects for intent, the creative earns the click, and the redesigned page makes the intake easy to finish. Follow-up time goes to people who have already invested effort, and Meta is judged on ROAS and patient economics instead of form-fill volume.
Creative, offer, and page are now separable levers. When cost per lead rose after leaving instant forms, the answer was not to retreat to quantity. It was to fix creative and completion on a better funnel, which brought CPL back down without giving up the qualification that made the channel work.
04
The evidence